Facttwin Connect®
Industrial Data Command Centre Connecting Industrial Devices Across All Levels
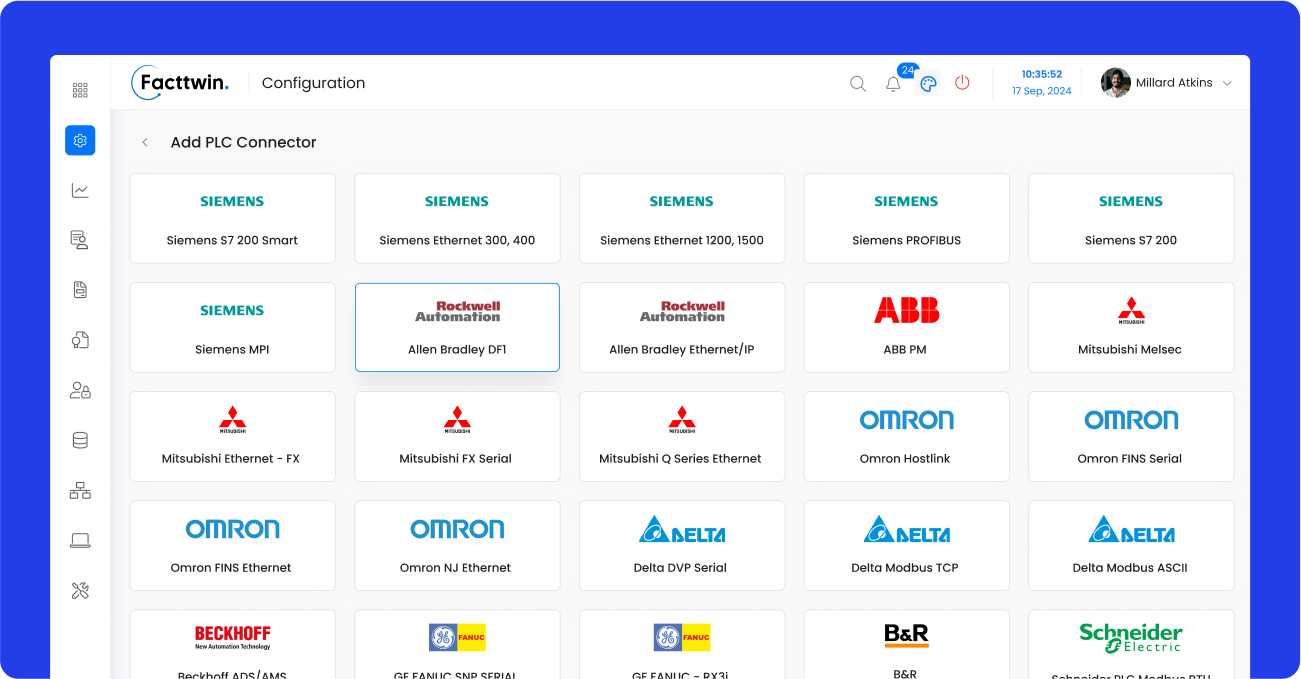
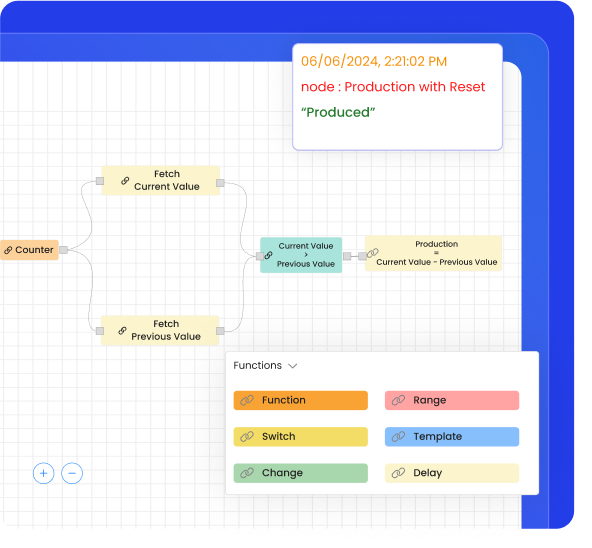
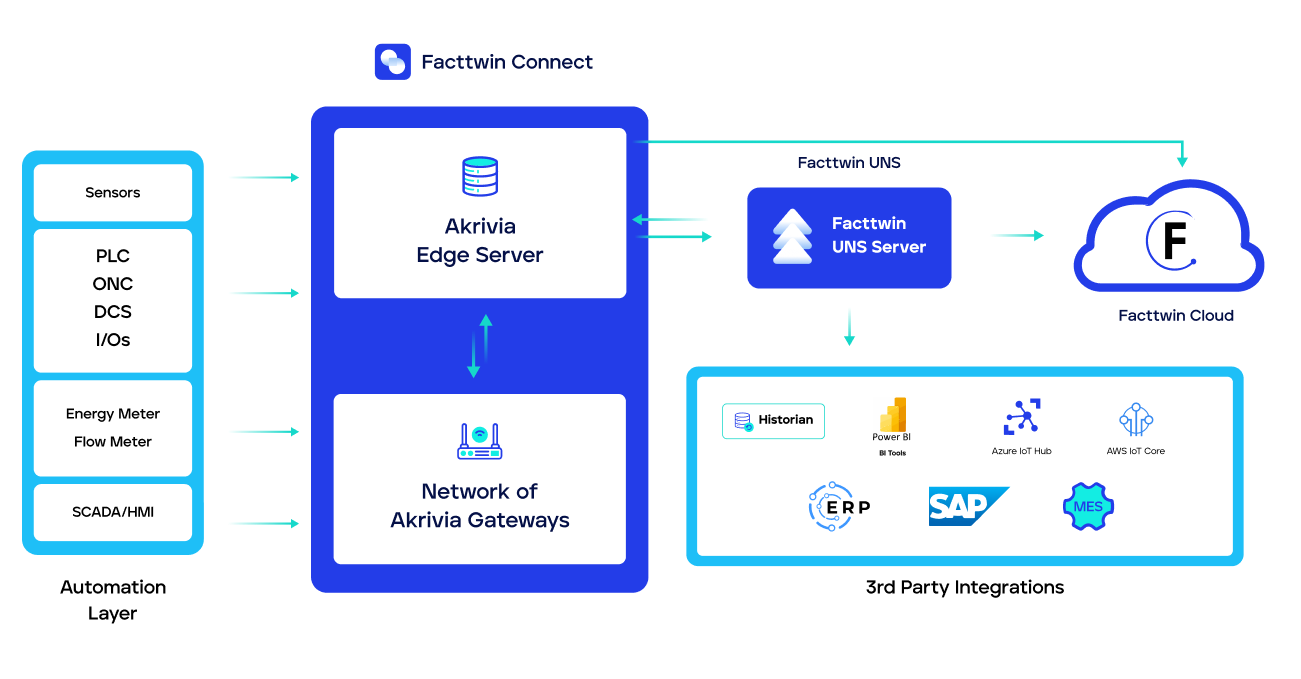
Seamlessly connect all industrial devices, from sensors to PLCs using both legacy and modern protocols. Capture real-time data across all levels of the ISA-95 model and create innovative industrial models.
Request a Demo